


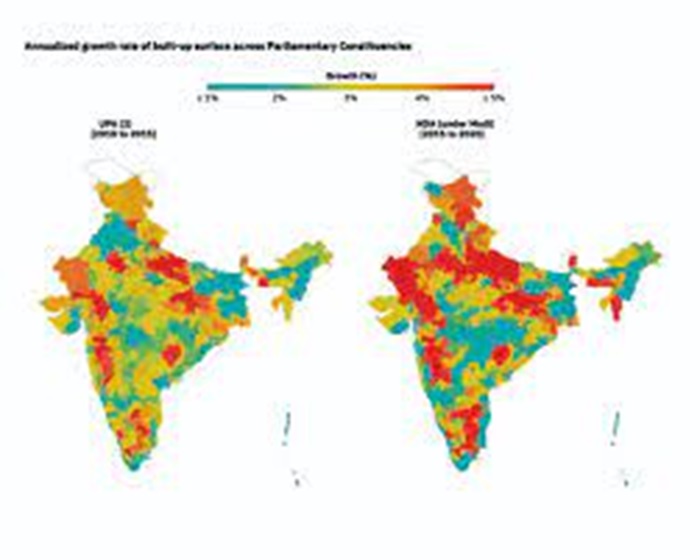
A study of the growth rates at local levels using high-resolution daytime satellite imagery data on built-up surfaces, shows significantly higher growth of built-up surface under the Modi years of 2015-2020 than the UPA years of 2010-15. The paper, “Politics in Action” by Shamika Ravi, member of the Economic Advisory Council to the Prime Minister, and Mudit Kapoor, Professor at the Indian Statistical Institute, computes the annualised growth rate from 2010 to 2015 and between 2015 and 2020, cuts across districts, sub-districts and Parliament constituencies across the country and assesses the level of construction activity. “At the all India level we can say, yes, constituencies or India’s construction as such across all parliamentary constituencies (PC) grew at about 18% higher on average than it did under the previous five years,” Ravi told The Sunday Guardian during an interaction.
Built up area constitutes anything the satellite image captures and gives an idea of how much of construction has taken place. “It can be anything from a small railway station to new roads, a new house and even the shed in the new house—everything will have been captured,” says Ravi. The paper, coming months before the general elections, testing the Prime Minister Narendra Modi-led NDA’s 10-year governance record, is premised on a wide acceptance that in a vibrant democracy, assessing the economic performance under different political regimes is crucial. However, the debate which gains traction near national elections, tends to centre on comparing growth rates or poverty reduction at the macro level. The paper is an effort to provide a more meaningful commentary of politics in action by assessing the economic performance at the parliamentary constituency level, district and sub-district level. The data set for the analysis comes from Global Human Settlement Layer (GHSL) project supported by the European …read more
Source:: News Wire